Litchfield County is located in the state of Connecticut. The population is 187,530.
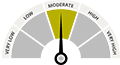
There are 90 public schools in Litchfield County with an average Homefacts rating of B. There are 214 registered sex offenders residing in the county. Unemployment in Litchfield County is moderate and the median home sales price is $0.