Hampton, Virginia

Population NR

Hampton is located in Hampton City County, VA. The population is , making Hampton the largest city in Hampton City County and the 8th largest city in the state of Virginia.

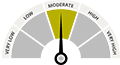
There are 37 public schools in Hampton with an average Homefacts rating of C. The total crime rate for Hampton is moderate , and there are 10 registered sex offenders residing in the city. Unemployment in Hampton is very high and the median home sales price is $0. Detailed and up-to-date Hampton property reports are available for any property address.

Cities near Hampton include Poquoson, Bethel Manor and Norfolk.

Hampton Neighborhood Report

Schools

School Rating is Average
  • No High School Diploma: 9.9%
  • High School Graduate or Higher: 67.4%
  • Bachelor's Degree or Higher: 22.7%

Crime Rate

24.56% Higher than national avg.
  • Auto theft: 188
  • Violent Crimes: 295
  • Robbery: 92
  • Burglary: 261
  • Property Crime: 2
  • Larceny Theft: 2

Registered Offenders

100.00% Lower than national avg.
  • 10 offenders in Hampton
  • 0.00 offenders/10,000 residents

Environmental Hazards

523 Found nearby
  • Brownfields: 21
  • Registered Polluters: 12
  • Superfunds: 13
  • Tanks & Spills: 477

Unemployment

Very High 4.5%
  • Virginia unemployment average: 3.2%
  • National unemployment average: 3.7%

Property Values

Median Property Value $0

Schools view all

37 Public Schools view public schools

Summary
There are 37 K-12 public schools in Hampton, VA and 14 private schools. Homefacts rates Hampton's schools as Average, with an overall C rating.

View All School Information

Crime view details

10 Registered Offenders search the registered offender database

View All Registered Offenders

Crime Index view report

*100 is national avg. Greater than 100 means higher crime, lower means less crime.
  • Total Crime Index
  • Violent Crime Index
  • Property Crime Index

0 Former Drug Labs view all

  • Good news! No Drug lab found in Hampton, VA

Property Reports view all

160 Building Permits View All

  •  
  • In 2014, the city of Hampton, VA issued 160 building permits. All permits issued were for Single Family Homes. All permits issued were for Single Family Homes.
  • In 2013, the city of Hampton, VA issued 253 building permits. All permits issued were for Single Family Homes. Of those 253 permits, 145 were issued for single family homes and 108 were issued for multi-family homes.
All Housing Single Family Housing Multi-Family Housing

Building Permits By Year

Fair Market Rents

**Displaying data from Hampton, VA
  • Property Type Rent
  • Studio: $1,010
  • 1 Bedroom: $1,030
  • 2 Bedrooms: $1,214
  • 3 Bedrooms: $1,690
  • 4 Bedrooms: $2,042

View All Home Reports

Environmental Hazards

523 Environmental Hazards

  • Brownfields
    in Hampton, VA
    view all
  • Registered Polluters
    in Hampton, VA
    view all
  • Superfunds
    in Hampton, VA
    view all
  • Tanks & Spills
    in Hampton, VA
    view all

Health Hazards

  • Air Quality HEALTHY (385/400)
    Hampton, VA has 96.25% good air quality.
    view all
  • Radon ZONE 3 COUNTY
    Hampton, VA is a green zone.
    view all
  • UV Index HIGH 5.15 Average
    Hampton, VA is a high risk area for ultra-violet rays.
    view all

Weather

  • We're sorry! No Weather statistics found in our database.

Average Monthly Temperature

  • January 42.33°
  • February 45.37°
  • March 52.85°
  • April 62.63°
  • May 70.58°
  • June 79.11°
  • July 82.16°
  • August 81.12°
  • September 74.68°
  • October 65.64°
  • November 54.27°
  • December 47.62°

View More About Environmental Hazards

Natural Disasters

Probability of Natural Disasters for Hampton, VA

Earthquakes
Hampton, VA has a very low risk of earthquakes.
Hurricanes
Hampton, VA has a moderate risk of hurricanes.
Hail
Hampton, VA has a low risk of hail storms.
Tornadoes
Hampton, VA has a high risk of tornadoes.

Demographics view details

Median Household Income

Median Household Income in Hampton, VA: $49,848

Unemployment

Unemployment in Hampton is 4.5%. It is higher than the state and national averages, 3.2% and 3.7% respectively

Workforce Breakdown

Blue Collar - 53.26%
White Collar - 46.74%

Politics

State Representatives

  • Gov. Terry McAuliffe
  • Sen. Tim Kaine
  • Sen. Mark R. Warner

City Representatives

  • Robert J. Wittman
  • Scott Rigell
  • Robert C. Scott

Neighborhood Info