Norfolk County is located in the state of Massachusetts. The population is 681,845.
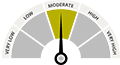
There are 188 public schools in Norfolk County with an average Homefacts rating of B+. There are 128 registered sex offenders residing in the county. Unemployment in Norfolk County is moderate and the median home sales price is $0.