Monterey Park, CA 91755

Population 27,334

91755 is zip code located in Monterey Park, California. The population is 27,334, making 91755 the 2nd largest zipcode in Monterey Park.

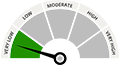
There are 0 public schools in 91755 with an average Homefacts rating of B+. The total crime rate for Monterey Park is low , and there are 4 registered sex offenders residing in the zip code 91755. Unemployment in 91755 is moderate.

Zip codes within Monterey Park include 91754 and 91756.

Monterey Park Neighborhood Report

Schools

School Rating is Very good

Crime Rate

1.22% Lower than national avg.

Registered Offenders

89.19% Lower than national avg.

Environmental Hazards

13 Found nearby

Unemployment

Moderate 4.3%

Property Values

Median Property Value $0

Schools view all

0 Public Schools view public schools

  • Top Rated Public School Rating
  • We're sorry! No schools found for 91755 in our database.
Summary
There are 0 K-12 public schools in 91755, CA and 2 private schools. Homefacts rates 91755's schools as Very good, with an overall B+ rating.
  • School District Rating
  • We're sorry! No School District is found our database.
2 Private Schools

Esther's Nest Children's School

New Avenue School

view all 2 private schools

0 Colleges & Universities view all colleges & universities

  • We're sorry! No colleges & universities found for 91755 in our database.

View All School Information

Crime view details

4 Registered Offenders search the registered offender database

View All Registered Offenders

Crime Index view report

*100 is national avg. Greater than 100 means higher crime, lower means less crime.
  • Total Crime Index
  • Violent Crime Index
  • Property Crime Index

0 Former Drug Labs view all

  • Good news! No Drug lab found in 91755.

Property Reports view all

Property Report Overview

Housing Inventory

Property Type
  • Vacant
    4.4%
  • Rented
    48.8%
  • Owned
    46.8%

31 Building Permits View All

  • In 2014, the city of Monterey Park, CA issued 31 building permits. All permits issued were for Single Family Homes. Of those 31 permits, 27 were issued for single family homes and 4 were issued for multi-family homes.
  • In 2013, the city of Monterey Park, CA issued 11 building permits. All permits issued were for Single Family Homes. All permits issued were for Single Family Homes.
All Housing Single Family Housing Multi-Family Housing

Building Permits By Year

Fair Market Rents

**Displaying data from CA 91755
  • Property Type Rent
  • Studio: $1,290
  • 1 Bedroom: $1,500
  • 2 Bedrooms: $1,910
  • 3 Bedrooms: $2,520
  • 4 Bedrooms: $2,740

View All Property Reports

Environmental Hazards

13 Environmental Hazards

  • Brownfields
    in Monterey Park, CA
    view all
  • Registered Polluters
    in Monterey Park, CA
    view all
  • Superfunds
    in Monterey Park, CA
    view all
  • Tanks & Spills
    in Monterey Park, CA
    view all

Health Hazards

  • Air Quality MODERATE (96/121)
    Monterey Park, CA has 79.34% good air quality.
    view all
  • Radon ZONE 2 COUNTY
    Monterey Park, CA is a yellow zone.
    view all
  • UV Index HIGH 6.98 Average
    Monterey Park, CA is a high risk area for ultra-violet rays.
    view all

Weather

  • We're sorry! No Weather statistics found in our database.

Average Monthly Temperature

  • January 59.43°
  • February 58.16°
  • March 61.08°
  • April 63.42°
  • May 66.13°
  • June 69.03°
  • July 72.18°
  • August 74.13°
  • September 71.68°
  • October 70.13°
  • November 63.07°
  • December 56.92°

View More About Environmental Hazards

Natural Disasters

Probability of Natural Disasters for Monterey Park, CA

Earthquakes
Monterey Park, CA has a very high risk of earthquakes.
Hurricanes
Monterey Park, CA has no risk of hurricanes.
Hail
Monterey Park, CA has a very low risk of hail storms.
Tornadoes
Monterey Park, CA has a very low risk of tornadoes.

Demographics view details

Median Household Income

Median Household Income in 91755: $48,350

Unemployment

Unemployment in Monterey Park is 4.3%. It is lower than the state and national averages, 4.1% and 7.7% respectively

Workforce Breakdown

Blue Collar - 38.43%
White Collar - 61.57%

Politics

State Representatives

  • Gov. Jerry Brown
  • Sen. Barbara Boxer
  • Sen. Dianne Feinstein

City Representatives

  • Judy Chu

Neighborhood Info

0 Airports view all

Nearest Major Airports

1 Cemetery view all

1 FCC Tower view all

0 Fire Stations view all

  • We're sorry! No fire stations found for 91755 in our database.

0 Hospitals view all

  • We're sorry! No hospitals found for 91755 in our database.

0 Libraries view all

  • We're sorry! No libraries found for 91755 in our database.

0 Police Stations view all

  • We're sorry! No police stations found for 91755 in our database.

0 Retirement Homes view all

  • We're sorry! No retirement homes found for 91755 in our database.